A SAP ECC system is an online transaction processing (OLTP) system. Good system performance is essential to the business and users to get the most out of the system. Regular proactive checks on system performance will help to identify any potential issues and ensure good system performance is available to those users
This document is a guideline process that, where possible, should be followed when reviewing SAP system performance and tuning
1) SM50 Process Overview
SM50 is also a snapshot view of current activities but specific to the instance you are logged onto.This shows all work processes configured for the instance
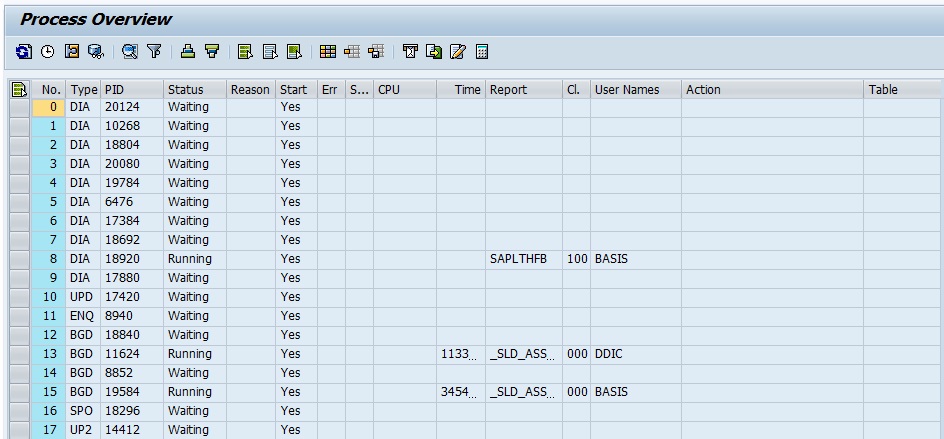
Check that there are free DIA work processes If all DIA work processes are in constant use this will lead to high ‘wait’ time and SAP will ‘hang’.
2) ST03 Workload Monitor:
Important for detailed analysis: Change to Expert Mode

If a problem is detected, the data in the workload monitor can be used as follows to identify the area of the system where the problem is located.
First check for general performance problems affecting all transactions. Good general performance is normally indicated by:
• Wait time < 10% response time
• Average roll-in time < 20ms
• Average roll wait time < 200ms
• Average load (and generation ) time < 10% of response time (< 50ms)
• Average database request time < 40% of (response time – wait time)
• Average CPU time < 40% of (response time – wait time)
• Average CPU time not much than processing time
• Average Dialog response time – Depends on customer requirements – there is no general rule but below 2 seconds is expected.
Analysis Roadmap: Using the Workload Monitor
• Wait time > 10% of response time?
• General performance problem?
• High Database time > 40% of response time?
Detailed analysis of the database
• Processing time > CPU time x 2?
– Detailed analysis of hardware bottlenecks
• Load time > 50 ms?
Detailed analysis of R/3 memory configuration (Is the program buffer too small?)
• Roll wait time or GUI time > 200 ms?
– Detailed analysis of interfaces and GUI communication.
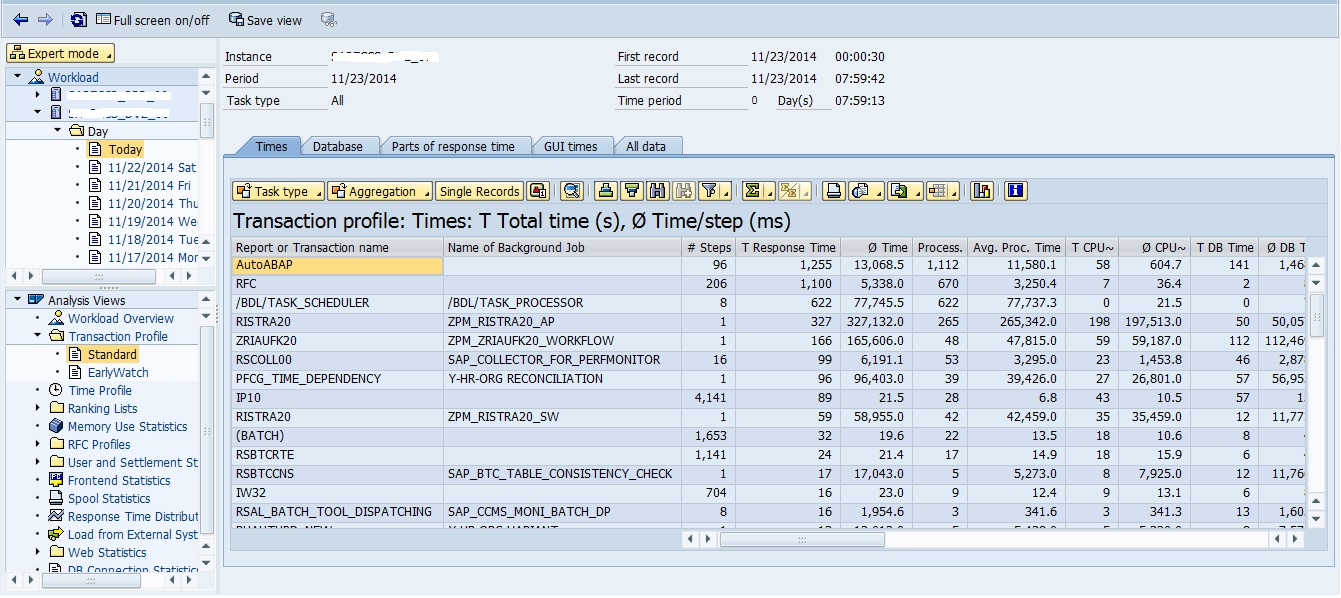
From detailed analysis > last minutes load > transaction profile enables you to find out the most used transactions and the average response time for these transactions. Tuning these transactions creates the greatest improvement in overall performance.
Analysis Roadmap: Using the Transaction Profile
• Transaction profile sorted by ‘Response time total’
• Programs with high CPU time: CPU time >40% of response time
Detailed analysis with ABAP Trace
• Programs with high database time: database time > 40% of response time
– Detailed analysis of SQL statements with SQL Trace
• Programs with high GUI times (> 200ms)
– Network Check
3) ST06 Operating System Monitor:
If it is OS side
Check whether both R3 and DB on same host.
Windows: Check the task manager for utilized memory/CPU usage
Linux/Unix: Check the top command for memory, CPU utilization..
Important Statistics displayed in the Operating System Monitor include:
• CPU load averages and % CPU utilization
• Operating system swapping and % memory utilization
• % disk utilization
• Operating system configuration parameters
CPU Bottlenecks are indicated during several snapshots by:
• Idle CPU <10%
• Load Average : N processes waiting in front of the CPU
Note: You must refresh the screen several times, as each display is a momentary snapshot.
Memory bottlenecks are indicated during several snapshots by:
An increase in page outs for UNIX or page ins for NT
4) ST02 Tune Summary:
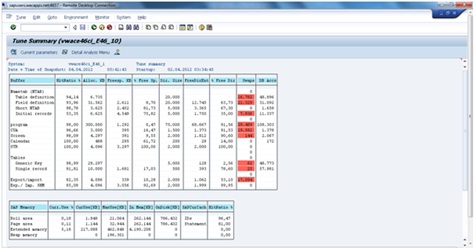
For the instance on which the user is logged on, ST02 shows the percentage usage of buffers and memory. Good System performance or good tuning is dictated by:
• Good buffer hit ratio > 97%
• Few buffer swaps < 5000 per day
• Some free space in buffer but not too much
Reasons for program buffer swaps could be that the program buffer is sized too small. This will lead to programs are swapped out, and the reload causes high load and long database request times. The solution is to increase the program buffer size.
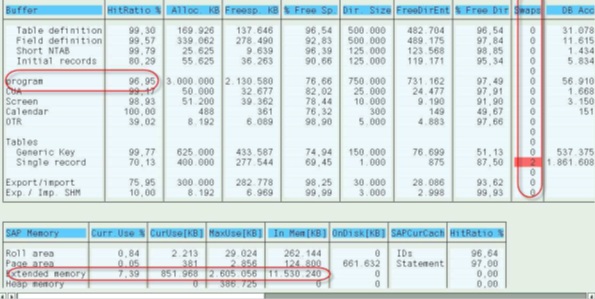
The lower part of ST02 displays data on extended memory size and usage.
No heap memory should be in use, this will lead to performance problems as physical memory is exhausted and SAP will be paging into operating system swap.
Memory utilization (Extended memory) Current use,<Maxuse<<In Mem
5) ST04 Database Performance Analysis :
The hit ratios for the memory buffers should be above 97%.
Looks for any high ‘IO busy’ and ‘physical read errors’ which would indicate a hardware bottleneck within the IO subsystem.
Improve catalog, datacache – check update statistics running daily or updated recently. Still datacache buffer quality is low than ask DB team to increase the same.
6) AL08 Users Logged On:
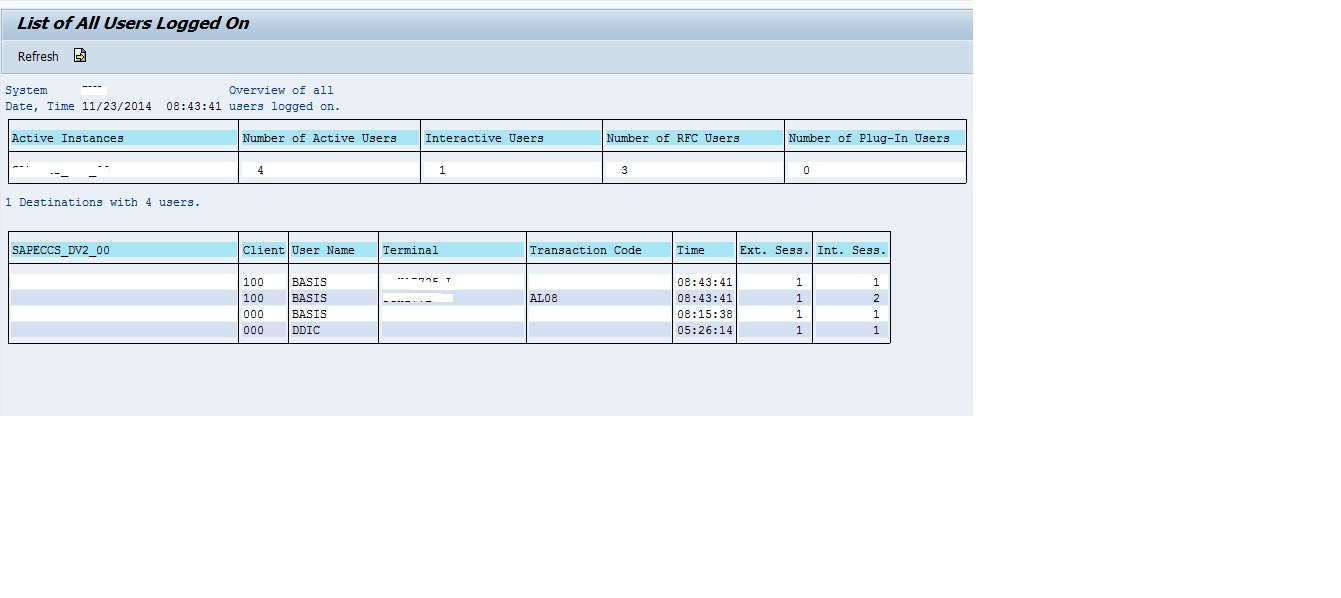
For those systems which use application servers and employee logon groups a large imbalance in the amount of users logged onto the application servers could lead to performance problems on that particular instance.
Make sure that no one application server has proportionally many more users that any other. Low number of users on Central Instances is good
Do the below check / action during initial check
1. Check SM21 system log for any error in the system.
2. Check ST22 for any dumps occurring due to memory, DB or ABAP repository.
3. Go to SM37 and check any long running jobs are active.
4. Do background job status by SM37->select all status except finished and cancelled. Now go to job -> check status -> Execute immediately.
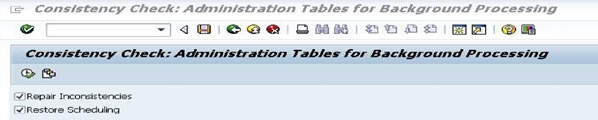
5. Run the report in se38: RSBTCCNS to clear the in consistencies for background jobs.
Run the report in se38: RSTS0043 to clear the logs: spool, background job logs.
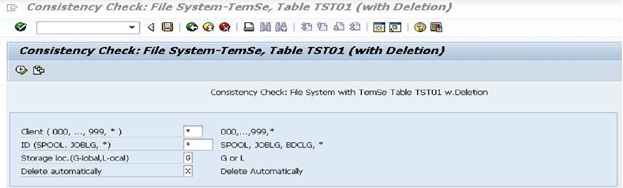
Do spool consistency check in SP12 ->TemSe Data Storage -> consistency check.